Suggested workflow
Briefly:
- draw your potsherd using Inkscape, or another SVG-capable software
- give your drawing an
svg:idattribute - wrap the drawing in a container with
svg:transform - add a
svg:preserveAspectRatioto yoursvgdocument
Drawing: a basic workflow
The most basic workflow is to use SVG from the start to save digitised drawings, rather than other formats available in the vector graphic software used.
Inkscape is the best solution to start digitising your drawings. Inkscape supports a large part of the SVG 1.1 standard, but it also has some extra features defined in the Inkscape SVG format, that is used by default when saving your work.
Warning
We suggest here not to use Inkscape SVG, because for publishing it’s important to use the standard SVG.
If you have legacy drawings in other formats, convert them to SVG. This is currently outside the scope of this document.
Almost all pottery drawings are not born digital. As a consequence, digitisation through tracing is the rule, not the exception. You need to import an existing drawing scanned from paper, and digitise it. This is straightforward in Inkscape. The only thing you should do is to have the scanned image on a separate layer from the digitisation.
Inkscape layers are just a shorthand for named SVG groups (the
svg:g element). You can give a name to a layer, if you want, such
as original and digitised.
Scale
It is good practice to give a metric scale together with your drawing. We think adding a “1:3” label in one corner of the printed drawing is a poor alternative that should be avoided: pottery drawings get copied very often both on paper and digitally. Adding a simple scale should not be very difficult.
If you do, it would be very good to use this scale also in the SVG drawing. As we will see, there are some issues with units and scale in SVG, so having a simple scale with a human-readable measure will be very useful. We could suggest to adopt a standard scale of a fixed measure, but for the moment being it will suffice to insert a clear indication, either by additional text or by using a black-and-white scale with 1 cm ticks.
Another attempt at defining scale is by scaling the drawing so that it matches the page size as if it was drawn on paper. Inkscape by default starts a blank document with an A4 page.
Human- vs machine-readable
A brief interlude about human- vs machine-readability will be helpful at this point to explain why we are paranoid about some apparently minor details.
Drawings on paper, or digitised as raster images, only have a proper meaning to us humans, in the sense that a software program could not extract any information from them, such as the size and shape of the pot (except by means of complicated procedures).
Using a vector format is a way to get machines to be able to read our hard work done by hand. If you only have one drawing, or ten, it’s not that interesting, but things are different in case there are hundreds of them, and chances are most people will have thousands.
Plain SVG
When you’re done with your drawing, Inkscape will still insist in saving it in the Inkscape SVG format every time. A useful workaround to this is to use Inkscape from the command line (we will be doing this a lot), like this:
inkscape -l drawing-plain.svg drawing-inkscape.svg
Metadata
You should add metadata (author, title, description) using the “Properties” or “File properties” dialog of the drawing program. The description and title can be as verbose as needed, and preferably consistent within a collection.
In the metadata editor, mark the file as distributed under a Creative Commons Attribution license ‒ ensuring ease of circulation and attribution for single files even when detached from the entirety of the archive.
Digitisation should be done according to the required graphical standard (e.g. section on left or right side, hatching colours, thickness of lines). An example is shown below, comparing the hand-made drawing with the SVG counterpart. Depending on the complexity of the drawing, this procedure is not time-consuming and can be performed in five minutes.
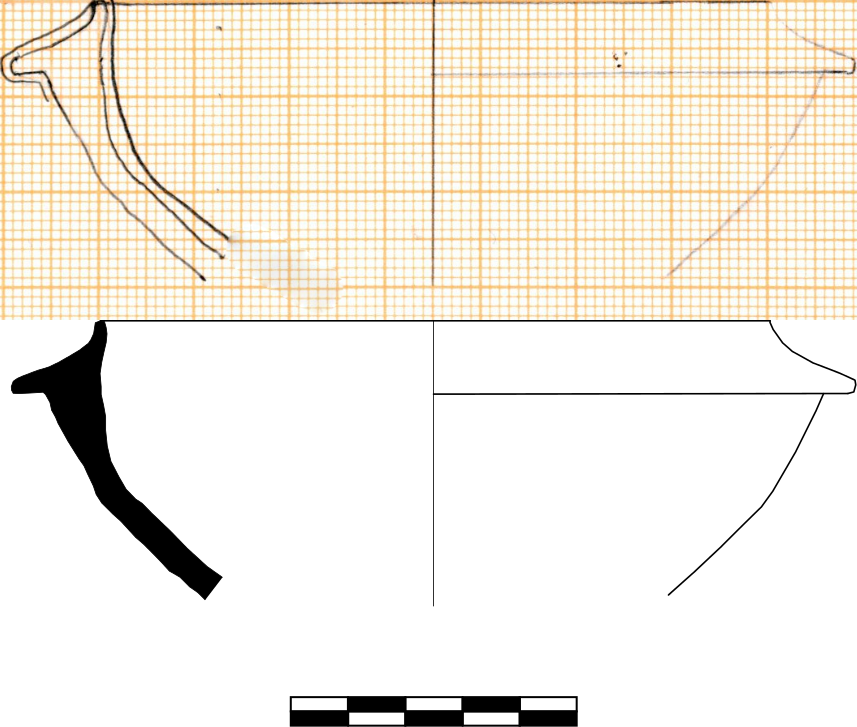
This workflow is also recommended as a reference in case of a conversion process from legacy or proprietary formats to SVG.
Advanced workflows
The basic workflow guarantees a solid base, but keeps possibilities for further processing confined to metadata. Advanced workflows make processing of geometric data attainable, but they require more digitisation time.
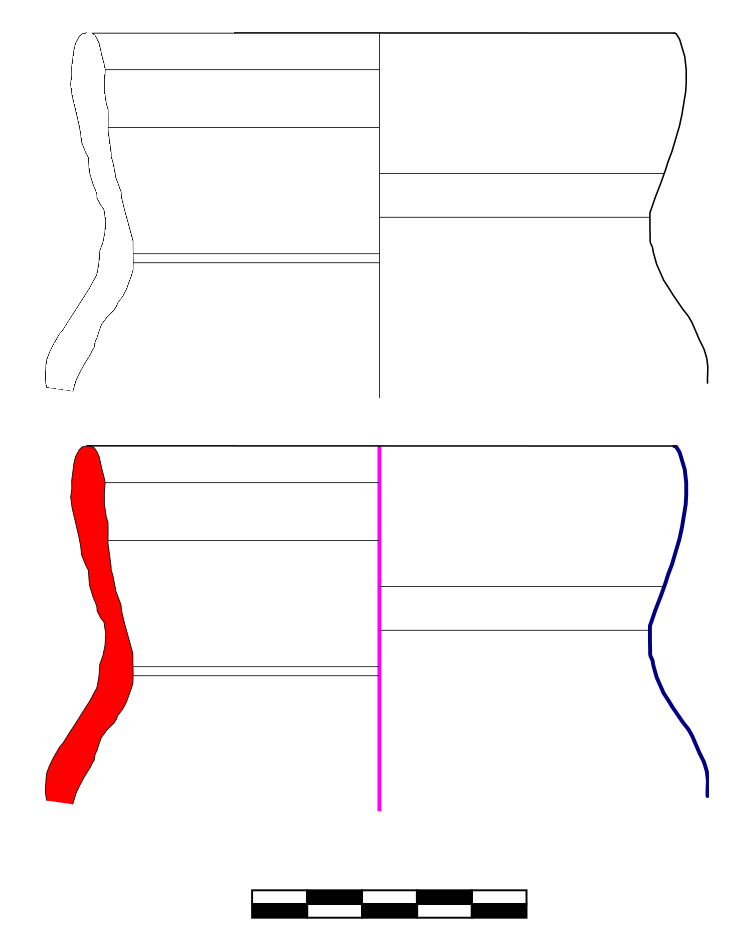
The first kind of advanced workflow is inspired by programs that calculate vessel capacity (a recent overview in [EBT2009]), and is based on a logical separation of the elements of the drawing: rotation axis, external profile, section are the three main elements to be considered, together with the metric scale. Drawing programs have a feature to give single objects an id attribute. The proposed convention is to adopt simple, unique and explicit labels like axis, profile, section, scale. An example in shown below, with different colours highlighting the separate elements. With such data available inside drawings, it is possible to automatically extract size and measurements in metric units. Comparison of vessel profiles (e.g. as described in [MTP2010]) is also technically possible and certainly not novel [SW1975].
| [EBT2009] | L. Engels, L. Bavay and A. Tsingarida 2009, “Calculating vessel capacities: a new web-based solution”, in A. Tsingarida ed. Shapes and Uses of Greek Vases (7th– 4th centuries B.C.), Brussels, Timperman, pp. 129-133. |
| [MTP2010] | I. Modrzewska, G. Taroni and F. Pianetti 2010, “Un’anfora frammentaria dalla Laguna di Venezia”, Archeologia e Calcolatori, 21, pp. 201-210. |
| [SW1975] | S.J. Shennan and J.D. Wilcock, 1975 “Shape and style variation in Central German Bell Beakers: a computer-assisted study”, Science and Archaeology 15, pp. 17–31. |
As explained above, handling of metric units is a weakness of SVG. The
<viewPort> element can be used to work around this problem, but to
the best of our knowledge no software program is capable of providing
an interactive management of this SVG feature. Thus, the only way to
pursue this task is to manually edit the source of the drawing. For
anyone who has ever written HTML, this is going to be a normal
operation. XML-conforming editors should be preferred. The W3C
Recommendation (Scalable Vector Graphics 1.1) contains detailed
instructions on how to approach this task, but our experience showed
that more than ten minutes may be required for each drawing.
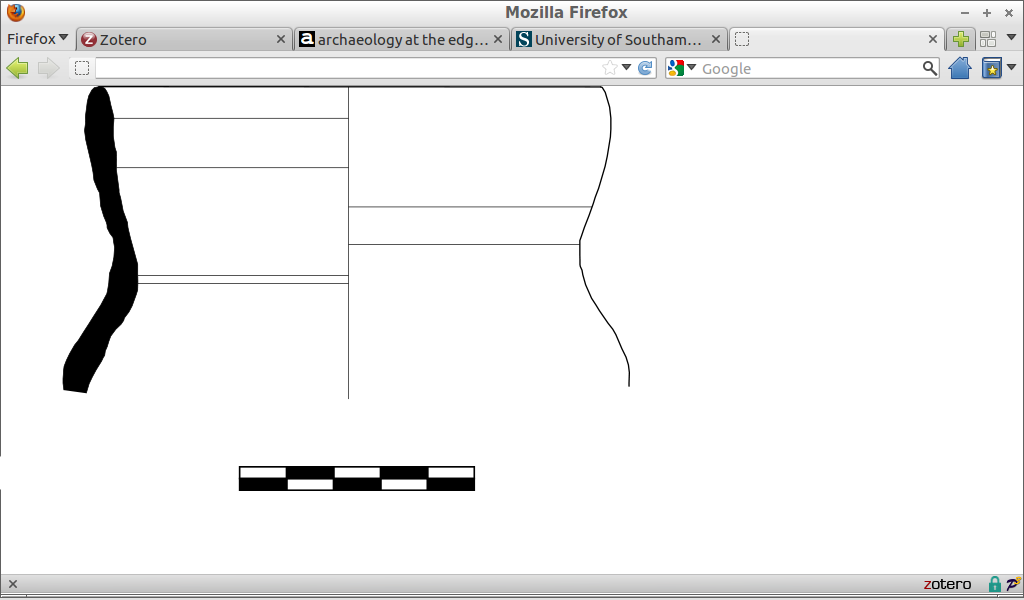
The third and final step of an advanced workflow is the actual publishing of SVG drawings on the Web. While applications of any complexity can be developed for the task, it is certainly recommended to start with simple steps, taking advantage of the fact that modern web browsers can natively display SVG drawings. An HTML index with links to the SVG files makes it possible to publish drawings even on a minimal web infrastructure, as may be the case with low-cost shared hosting, only by uploading the containing directory via FTP. A basic example is shown below.